
Climate science.
In finer detail.
1 km climate projections across New Zealand.
46 model chains. A broader scientific perspective.
A clearer view of what comes next.
A complex landscape.
A more detailed view.
Mountain ranges. Rain shadows. Coastlines. New Zealand’s climate changes over remarkably short distances.
NZM1K brings a 1 km national grid together with 46 global–regional model chains: 18 global models and six regional configurations. Exceptional spatial detail and a much broader view of model uncertainty for New Zealand climate risk analysis.
More detail in
the same space.
A 5 km square becomes twenty-five 1 km cells. The area stays the same. The view becomes finer.
25×as many grid cells
per unit area
Finer detail.
A far broader ensemble.
Twenty-five 1 km cells cover the area of one 5 km cell. NZM1K combines this finer grid with 46 model chains, compared with six in the national 5 km projections. Its 18 global models and six regional configurations provide a much wider range of model structures for climate risk analysis.
Compare with the national 5 km datasetFour pathways.
Two at the core.
Core: SSP1-2.6 and SSP3-7.0.
Also available: SSP2-4.5 and SSP5-8.5.
The additional pathways have different model coverage. We confirm the available models, variables and periods when scoping your project.
The 25× comparison describes grid-cell density. The ensemble spans different model structures; its chains are not independent predictions. Interpreting that detail and uncertainty is part of the science.
About these mapsSee the change.
Explore the detail.
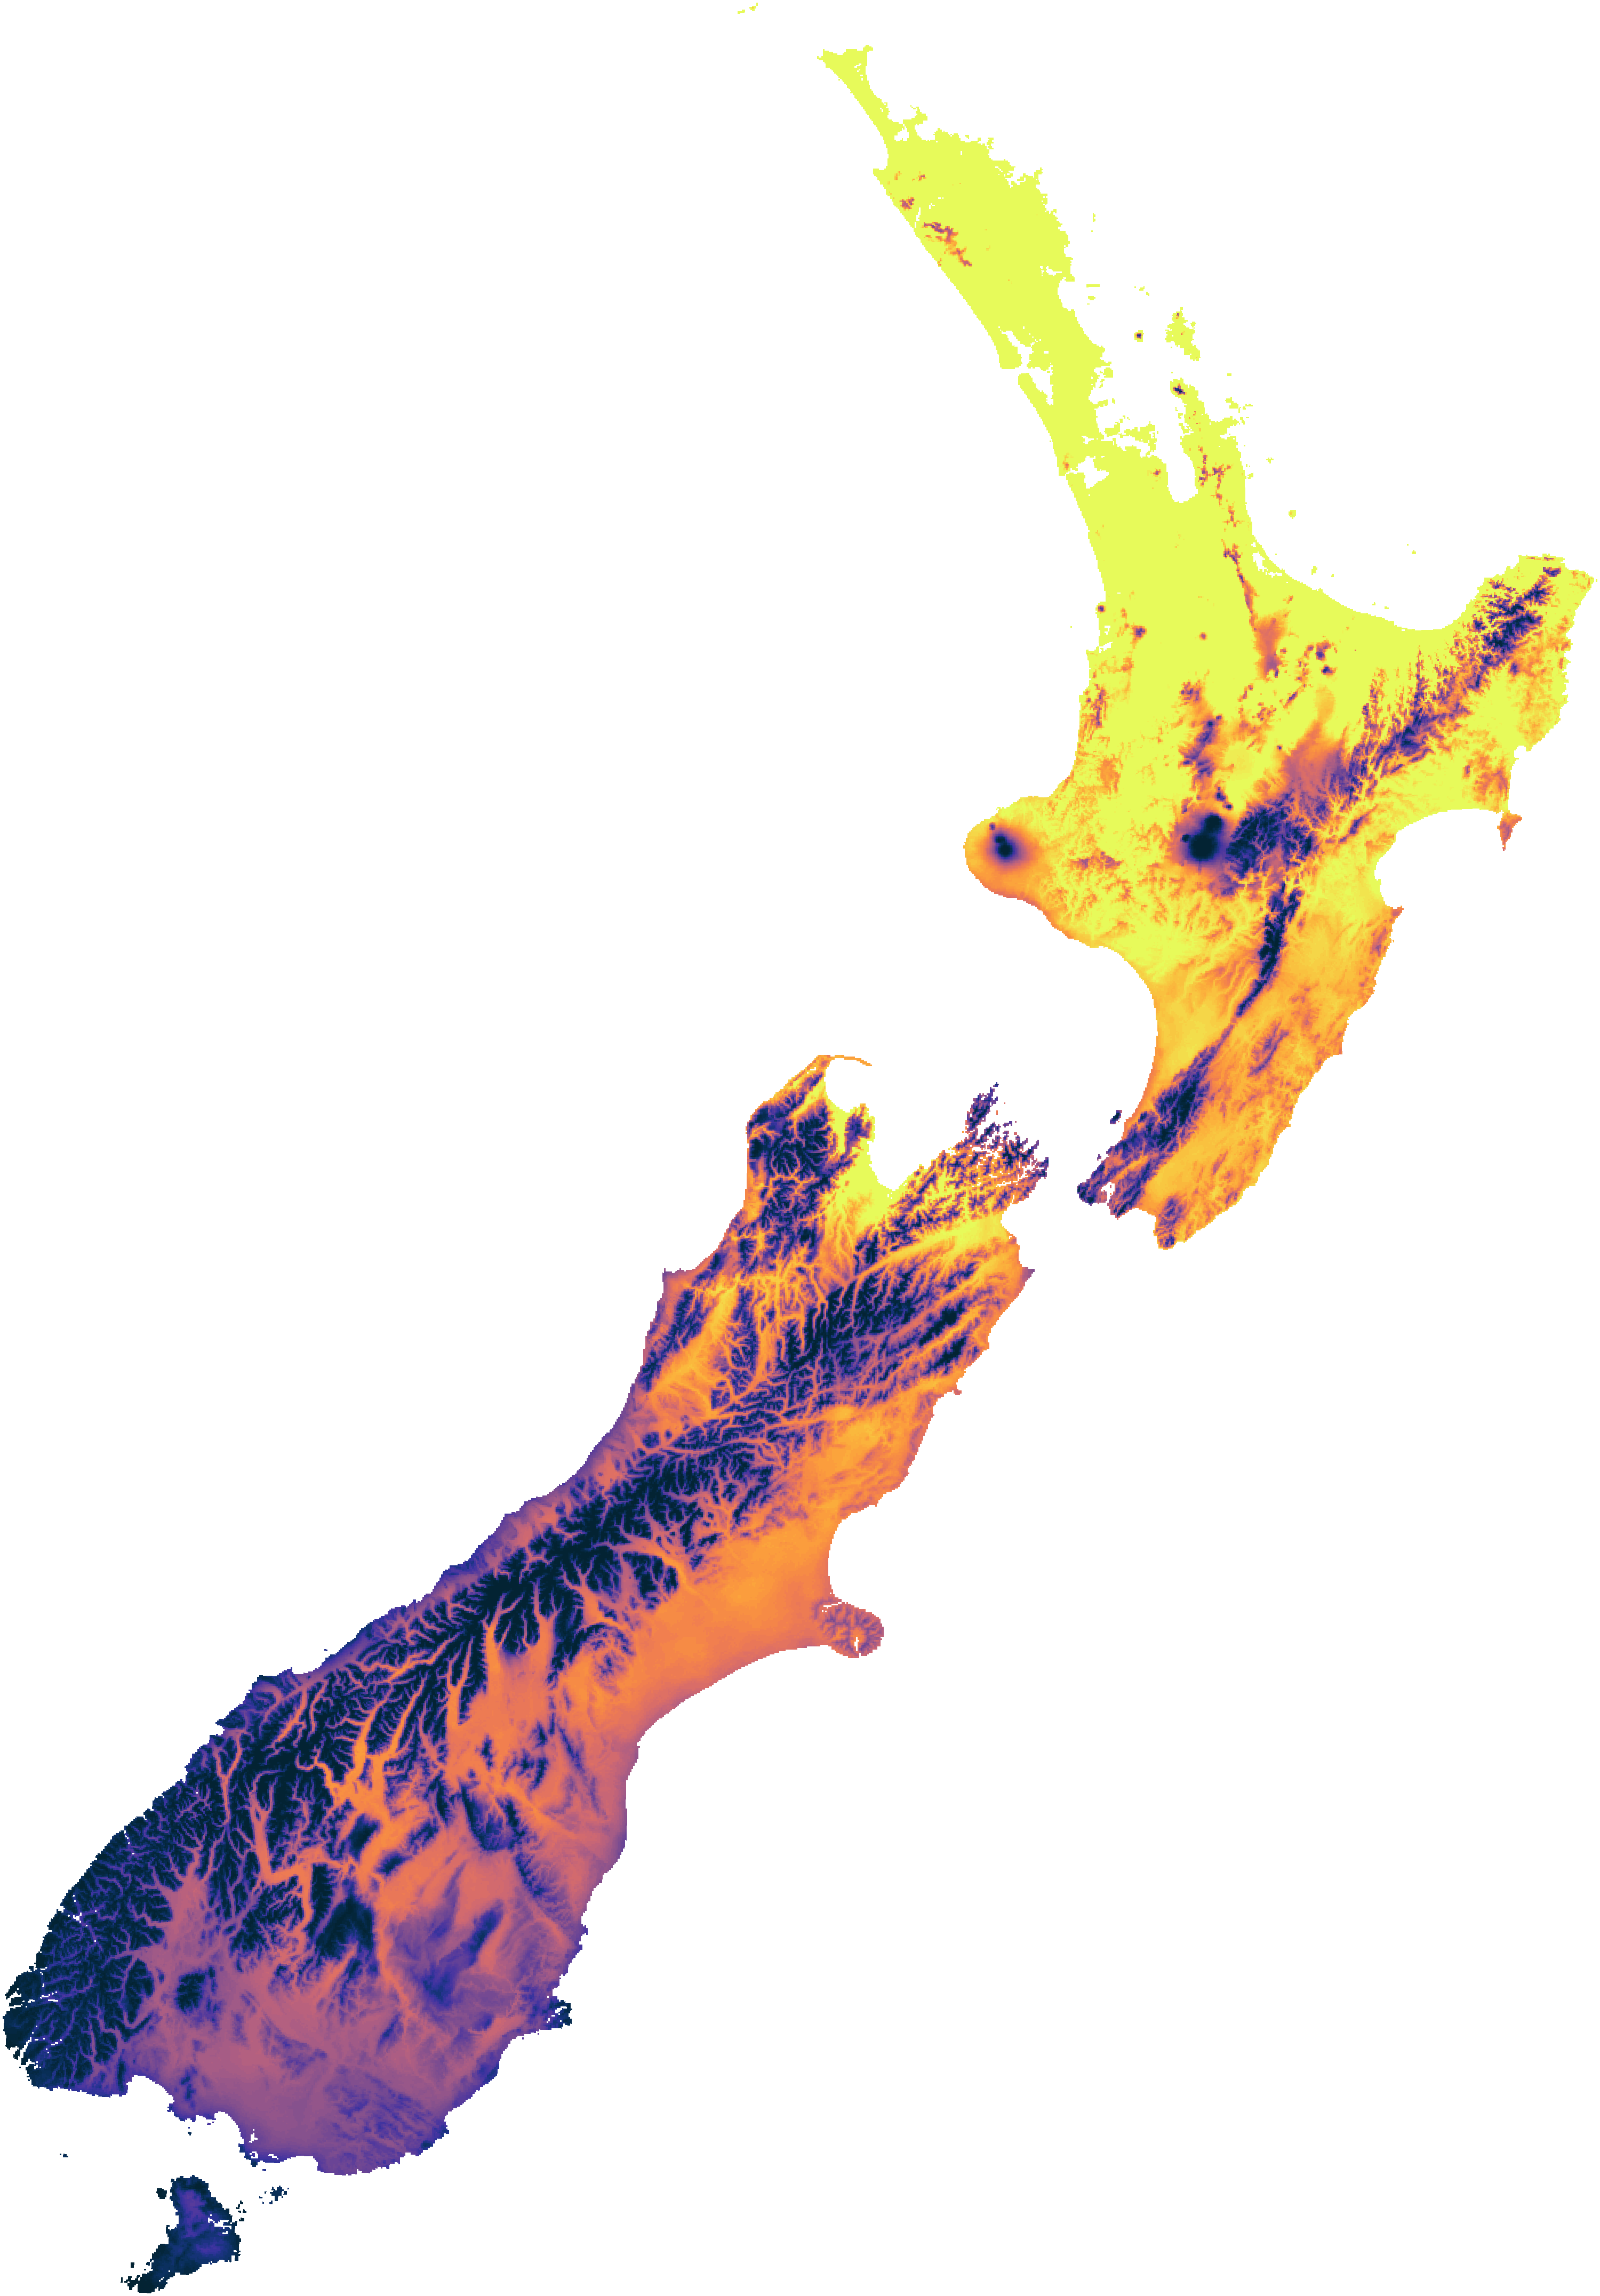
How many more hot days might your region experience? Explore changes in days above 25°C and 30°C, alongside rainfall and variability change. All 274,834 native 1 km land cells are retained.
Additional days per year · median change
cmocean thermal · 1-day colour bands · loading colour key
Read a description of this map
Hot days · Tmax >25°C: median change
Compare the increase in annual hot days between pathways and time periods. The map preserves the local contrasts between lowlands, valleys and higher terrain.
The cmocean thermal scale runs from 0 to 60 additional days per year, with a colour break every day. Dark blue and purple show smaller increases, progressing through red and orange to pale yellow for larger increases. Values above 60 days use the top colour.
These descriptions summarise broad visual patterns. Local values and project interpretation require the underlying scientific data. Request information in an accessible format.
About these maps
Median change in annual hot days
Count days with daily maximum temperature strictly above 25°C in each complete year, average annual counts for each period, then subtract the same model chain and pathway’s 2015–2024 mean. The map is the median of those 46 changes.
The NZM1K methods manuscript has been submitted for peer review.
The comparison
SSP3-7.0 in 2080–2099 is compared with the same model chain and pathway in 2015–2024. Each chain has equal weight.
The cmocean thermal palette uses one-day bands from 0 to 60 additional days per year. All hot-day panels share this scale. Values above 60 days use the top colour.
From patterns to projects
Explore the spatial patterns at native 1 km resolution. Colours are for visual exploration; project analysis uses the underlying scientific data.
A climate grid cell is not a property assessment, and Rx1day is not a return-period design storm. Discuss the data and interpretation your project needs
Your team’s question.
Our scientific perspective.
Specialist climate support for consulting, risk and planning teams. Bring the project brief; we provide the data, analysis and interpretation that fit your workflow.
Climate data
The right inputs, ready to use.
NZM1K data selected for your geography, variables, scenarios and time horizons. Supplied with versioned metadata, provenance and an explanation of appropriate use.
Tailored analysis
From climate inputs to useful evidence.
Calculations, scenario comparisons, figures and GIS outputs designed around your question. Methods and checks are documented so your team can understand and use the results.
Scientific interpretation
Know what the results really mean.
Direct scientific input from Dr Nathanael Melia: interpreting the signal, explaining uncertainty and identifying the limits relevant to your assessment.
Scoped and quoted to your project.
Start with the question, location, outputs and deadline.
Science that reaches
real decisions.
Climate Prescience and Nathanael Melia’s wider research have supported organisations working across government, transport, conservation, primary industries and emergency management.
Research end users
- Ministry of Business, Innovation and Employment

- Ministry for the Environment

- NZ Transport Agency Waka Kotahi

- Department of Conservation

- Ministry for Primary Industries

- Fire and Emergency New Zealand

- Parliamentary Commissioner for the Environment

- Emergency Management Otago

Collaborators
Research connections across universities, science organisations, government and the risk sector.

- Aon

- Reserve Bank of New Zealand
- Ministry of Business, Innovation and Employment
- University of Canterbury

- Earth Sciences New Zealand

- Bioeconomy Science Institute
Explore examples of commissioned research and its use in climate and emergency planning.
The work behind
the perspective.
Research into climate projections, extremes and uncertainty is the foundation of Climate Prescience. Selected publications by Nathanael and collaborators.
New Zealand’s changing
wildfire climate.
Exploring the emergence of more severe fire weather across Aotearoa New Zealand.
The human fingerprint
in fire weather.
Separating human influence and natural variability in western North American fire weather.
Rising fire weather
in South East England.
A large climate-model ensemble puts the 2022 heatwave and fires in a longer-term context.
Science in the
public conversation.
Dr Nathanael Melia regularly contributes expert commentary to New Zealand’s Science Media Centre, bringing independent climate science into reporting on extreme weather, climate risk, forestry and adaptation.
The science behind adaptation
Why national coordination and well-framed climate questions matter for adaptation decisions.
El Niño and forecast uncertainty
What a strong El Niño may mean for New Zealand, and the limits of seasonal prediction.
Climate risk beyond the average
Why extremes and uncertainty matter when planning for a changing climate.
Forecasting intense local rainfall
The investment in detailed forecasting needed to turn weather science into better warnings.
When terrain, wind and fire meet
How local topography and extreme winds shaped wildfire conditions around Kaikōura.
Forestry, carbon and climate policy
Scientific perspective on carbon forestry and methane emissions.

Selected contributions to the Science Media Centre’s expert commentary series.

Dr Nathanael Melia
Climate scientist & founder
I founded Climate Prescience to bring climate research into the questions people need to answer. My work spans climate projections, extreme weather and the uncertainty that shapes future risk.
When you work with Climate Prescience, you work directly with me. I direct and review the science, and help your team understand what the evidence means for its project.
Academic profileBring a question.
See further.
Tell us what you’re working on.
A short email is a good place to start.